![tatari-lockup-black.png]](https://tatari-5147324.hs-sites.com/hs-fs/hubfs/tatari-lockup-black.png?height=40&name=tatari-lockup-black.png)
A TV spot is unlikely to cause someone to not visit your website or download your app who would have done so otherwise if not for seeing that spot.
However, there are occurrences where this can happen statistically due to noisiness in the baseline.
Response measurement (website visits or installs) on small time scales is inherently noisy. This means that there are fluctuations up and down from minute to minute that cannot be controlled or predicted.
With TV lift, we are therefore trying to measure a signal that is co-mingled with this noisy background traffic. To better understand this process, we can consider this measurement as having three components:
- Average background response: This is represented by the smooth baseline, and changes slowly as the macro-level background response measurement changes over time.
- Response noise: This represents the random fluctuations above and below the baseline on a minute-to-minute basis. Theoretically, this component has an average value of 0.
- Lift in the presence of a TV spot: These are the responses contributed by the audience that sees the spot and subsequently converts. We assume this can never be negative, as it is only contributing excess response above the background converting the population.
A real-world example of spots with significant lift illustrates these 3 components:

When measuring spot lift, we can consider these three components as purely additive. When we take the total response conversions in the presence of a TV spot and subtract out the baseline, we are left with the spot lift and noise components. For a single spot with a small lift relative to the noise, the noise can overwhelm the lift, and give spurious results.
A real-world example of spots with little (possibly negative) directly-measurable lift:

If we look at any single minute, since the noise is random and centered around 0, the value contributed by noise can be negative. Over the span of a few minutes of spot-related response conversions, the total noise contribution can still be negative and larger in magnitude than spot lift, which leads to a negative measurement of spot lift for the given small spot. Given enough minutes of measurement (think many small spots measured together), the noise component will tend to 0 and give us a valid measurement of spot lift in aggregate.
Simulated example (single small spot):
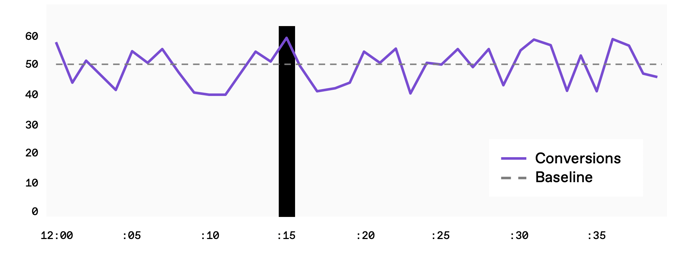

Simulated example (many small spots in aggregate):

If we were to bound the measured lift values for individual spots at 0 (on the low side), we would be excluding some of the negative noise values, which would then bias the average noise value positive (over many spots), and therefore artificially provide positive bias to the overall lift measurement.
Therefore, in the presence of a noisy response conversion measurement, we have to allow these negative lift values to persist, which in the long run leads to a more accurate measurement of spot lift.
You can now find negative lift values in version 2 linear spend and impression files within your Tatari S3 bucket.